前戏
小白: 前文我们提到了
Fluent Bit采集器, 我对它的一些配置信息很感兴趣, 它是如何高效采集的?
老花:
Fluent Bit作为一个轻量级的日志收集器,特别适合在 Kubernetes 环境中作为 DaemonSet 运行。它的核心配置涉及服务(services), 解析器(parsers),输入配置(inputs), 输出配置(outputs)等。总结来说, 一套日志流可以定义多个插件, 通过tag和match来流转。
Fluent Bit 核心配置解析
Fluent Bit 架构图
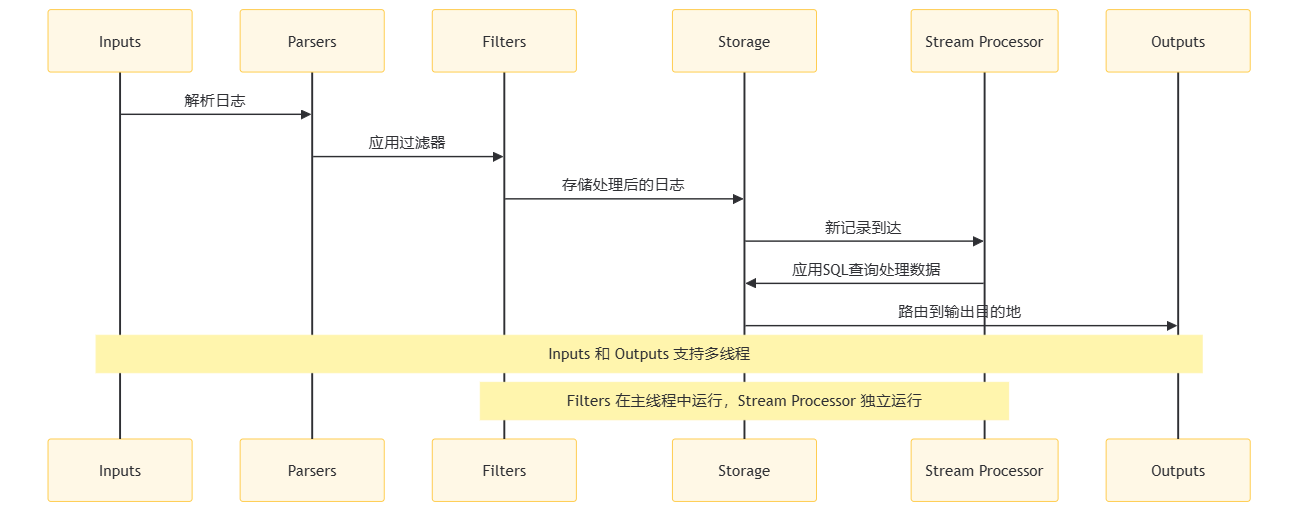
在这个时序图中:
- Inputs:输入插件收集来自不同输入源的日志记录。
- Parsers:解析器插件解析输入的日志记录。
- Filters:过滤器插件对日志记录进行特定的修改,如添加或删除键值对,丰富特定元数据,或基于特定条件丢弃记录。
- Storage:处理后的数据被认为是安全状态(要么在内存中,要么在文件系统中),然后记录通过适当的输出目的地进行路由。
- StreamProcessor:流处理器是一个独立的子系统,它检查存储接口上的新记录。通过配置,流处理器可以附加到来自特定输入插件的记录,或通过应用标签和匹配规则。
- Outputs:输出插件将处理后的数据发送到配置的输出目的地。
多线程
Fluent Bit会自动管理输入和输出插件的线程,确保在多线程环境中高效运行。过滤器始终在主线程中运行,而处理器则在各自的输入或输出的独立线程中运行。
内存管理
在容器化环境中,估算Fluent Bit的内存使用量至关重要。可以通过设置Mem_Buf_Limit选项来限制输入插件的内存使用。例如,如果设置Mem_Buf_Limit为 10MB,输出插件在最坏情况下可能会使用20MB,因此总内存需求应为30MB(10MB + 20MB),再加上一定的安全余量。
增量采集
Fluent Bit 通过检查日志文件的偏移量来实现增量采集。它会记录每个文件的最后读取位置,并在下一次采集时从该位置开始,确保不会重复采集。
缓冲与存储
Fluent Bit通过缓冲机制临时存储处理后的数据,直到数据准备好被发送。Fluent Bit使用内存作为主要的临时存储位置,但在某些场景下,使用基于文件系统的持久缓冲机制可以提供聚合和数据安全能力。- 输入插件发出的记录被引擎组合在一起形成块,通常大小约为
2MB,默认仅在内存中创建。 - 如果仅设置内存作为缓冲,它将尽可能多地在内存中存储数据。这是最快的机制,但如果服务因网络慢或远程服务无响应而无法快速分发记录,
Fluent Bit的内存使用量将增加。
背压问题
当日志或数据的产生速度, 超过其被刷新到某些目的地的能力时,会产生背压,导致服务内存消耗增加。Fluent Bit通过Mem_Buf_Limit和storage.Max_Chunks_Up配置参数限制输入插件可以摄入的数据量。
核心配置项
- buf_chunk_size: 缓冲区块大小,用于存储日志数据。
- buf_max_size: 缓冲区最大大小。
- batch_size: 每个批次发送的日志条目数。
- batch_wait: 等待更多日志条目到达以填满批次的时间。
- mem_buf_limit: 内存缓冲区限制。
- mem_buf_flush_count: 触发缓冲区刷新的日志条目数。
这些配置影响内存的使用, 是否产生背压, 以及写入后端outputs的效率(攒批)。
标签和路由
- labels: 为日志条目设置标签,用于路由和过滤。
- match: 定义路由规则,用于匹配特定的日志条目。
grafana/fluent-bit 的一些配置介绍
老花:首先,我们得知道 Fluent Bit 的核心配置有哪些,以及它们的作用, 相对应地, 我们可以调整以下配置:
loki.serviceName:这是 Loki 服务的地址,
Fluent Bit会将日志发送到这里。默认是${RELEASE}-loki,但可以根据你的 Loki 服务部署情况进行修改。loki.servicePort:Loki 服务的端口,默认是 3100,但如果你的 Loki 服务端口不同,需要相应调整。
loki.serviceScheme:Loki 服务的访问协议,默认是 http,如果你的 Loki 服务使用 https,则需要修改。
config.batchWait和config.batchSize:这两个参数控制日志批量发送的时机和大小。
batchWait是等待时间,batchSize是批量大小,合理配置可以提高采集效率,减少背压。config.loglevel:
Fluent Bit的日志级别,可以设置为 debug, info, warn, error,根据需要调整。config.lineFormat:记录的格式,可以是 json 或 key_value,根据你的日志格式选择。
config.k8sLoggingParser和config.k8sLoggingExclude:这两个参数允许 Kubernetes Pods 建议预定义的解析器或排除日志。
config.memBufLimit:内存缓冲区的限制,默认是 5MB,可以根据实际情况调整。
config.removeKeys和config.labels:这两个参数分别用于从每个记录中移除键和为每个日志添加标签。
老花: 作为一个高可用系统, 采集端要高效, 存储端也要尽可能保持高可用。下面我们聊聊 loki 如何高可用呢?
高可用 Loki 集群部署
loki 如何做到高可用?
Loki 是一个水平可扩展的日志聚合系统,它被设计为简单、高性能、易于操作。在 Loki 中,多个写入副本(ingesters)之间的数据同步是通过一个称为 Distributor 的组件来协调的。以下是 Loki 中多个写入副本之间同步数据的大致流程:
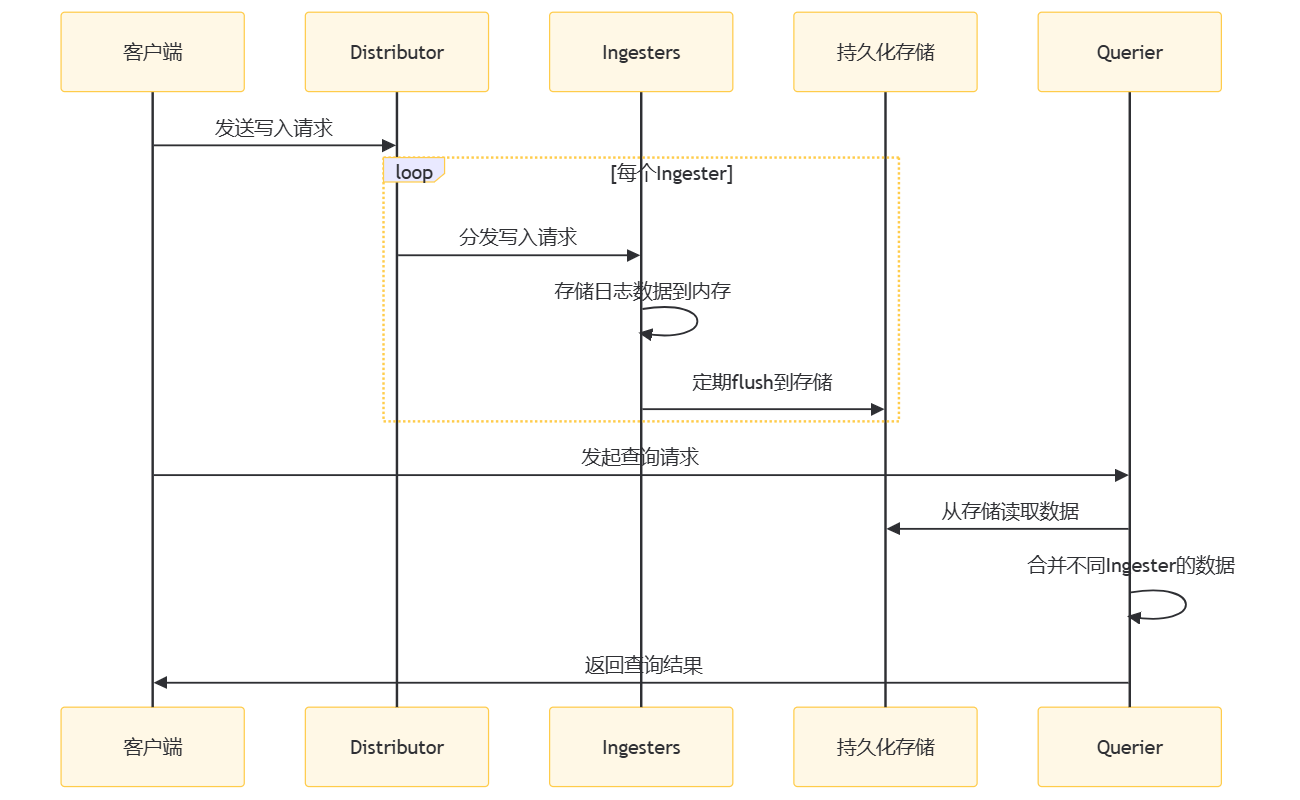
在这个时序图中:
- 客户端(C)首先向 Distributor(D)发送写入请求。
- Distributor(D)将写入请求均匀地分发到不同的 Ingesters(I)。
- 每个 Ingester(I)接收日志数据,并将其存储在内存中。
- Ingesters(I)定期将内存中的数据 flush 到持久化存储(S)中。
- 当客户端(C)发起查询请求时,Querier(Q)从持久化存储(S)中读取数据。
- Querier(Q)合并来自不同 Ingesters 的数据,以提供完整的日志数据视图。
- 最后,Querier(Q)将查询结果返回给客户端(C)。
通过这种设计,Loki 能够在多个 ingesters 之间实现数据的同步和高可用性,同时保持系统的可扩展性和容错性。
loki 高可用如何部署?
组件安装
执行以下命令:
$ docker pull grafana/loki:2.9.10
$ docker pull docker.io/nginxinc/nginx-unprivileged:1.20.2-alpine

$ kind load docker-image grafana/loki:2.9.10 --name mongodb-sharded
$ kind load docker-image docker.io/nginxinc/nginx-unprivileged:1.20.2-alpine --name mongodb-sharded

$ helm upgrade --install loki grafana/loki-distributed --set ingester.replicas=3,ingester.maxUnavailable=1,querier.replicas=2,querier.autoscaling.enabled=true,querier.maxUnavailable=1,distributor.replicas=1,distributor.autoscaling.enabled=true --create-namespace --namespace=loki
由于grafana不在chart中, 需要单独安装:
$ helm upgrade --install loki-grafana grafana/grafana --set image.tag="10.3.3" --create-namespace --namespace=loki
$ helm list -n loki
NAME            NAMESPACE       REVISION        UPDATED                                 STATUS          CHART                   APP VERSION
fluent-bit      loki            2               2024-12-06 16:53:19.517610466 +0800 CST deployed        fluent-bit-2.6.0        v2.1.0
loki            loki            5               2024-12-09 20:18:59.189271314 +0800 CST deployed        loki-distributed-0.80.0 2.9.10
loki-grafana    loki            1               2024-12-10 08:38:44.255132022 +0800 CST deployed        grafana-8.6.4           11.3.1
获取所有组件的service:
$ kubectl -n loki get svc
NAME                                            TYPE        CLUSTER-IP     EXTERNAL-IP   PORT(S)                      AGE
loki-loki-distributed-distributor               ClusterIP   10.0.166.176   <none>        3100/TCP,9095/TCP            6m48s
loki-loki-distributed-gateway                   ClusterIP   10.0.227.135   <none>        80/TCP                       6m48s
loki-loki-distributed-ingester                  ClusterIP   10.0.84.41     <none>        3100/TCP,9095/TCP            6m48s
loki-loki-distributed-ingester-headless         ClusterIP   None           <none>        3100/TCP,9095/TCP            6m48s
loki-loki-distributed-memberlist                ClusterIP   None           <none>        7946/TCP                     6m47s
loki-loki-distributed-querier                   ClusterIP   10.0.124.140   <none>        3100/TCP,9095/TCP            6m48s
loki-loki-distributed-querier-headless          ClusterIP   None           <none>        3100/TCP,9095/TCP            6m48s
loki-loki-distributed-query-frontend            ClusterIP   10.0.243.144   <none>        3100/TCP,9095/TCP,9096/TCP   6m48s
loki-loki-distributed-query-frontend-headless   ClusterIP   None           <none>        3100/TCP,9095/TCP,9096/TCP   6m48s
网关探秘
我们看到这里有一个gateway的组件, 实际上loki-distributed采用的是nginx作为网关进行负载均衡和读写分离:
$ kubectl -n loki get cm loki-loki-distributed-gateway -oyaml
nginx.conf: |
    worker_processes  5;  ## Default: 1
    error_log  /dev/stderr;
    pid        /tmp/nginx.pid;
    worker_rlimit_nofile 8192;

    events {
      worker_connections  4096;  ## Default: 1024
    }

    http {
      client_body_temp_path /tmp/client_temp;
      proxy_temp_path       /tmp/proxy_temp_path;
      fastcgi_temp_path     /tmp/fastcgi_temp;
      uwsgi_temp_path       /tmp/uwsgi_temp;
      scgi_temp_path        /tmp/scgi_temp;

      proxy_http_version    1.1;

      default_type application/octet-stream;
      log_format   main '$remote_addr - $remote_user [$time_local]  $status '
            '"$request" $body_bytes_sent "$http_referer" '
            '"$http_user_agent" "$http_x_forwarded_for"';
      access_log   /dev/stderr  main;

      sendfile     on;
      tcp_nopush   on;
      resolver kube-dns.kube-system.svc.cluster.local;

      server {
        listen             8080;

        location = / {
          return 200 'OK';
          auth_basic off;
          access_log off;
        }

        location = /api/prom/push {
          set $api_prom_push_backend http://loki-loki-distributed-distributor.loki.svc.cluster.local;
          proxy_pass       $api_prom_push_backend:3100$request_uri;
          proxy_http_version 1.1;
        }

        location = /api/prom/tail {
          set $api_prom_tail_backend http://loki-loki-distributed-querier.loki.svc.cluster.local;
          proxy_pass       $api_prom_tail_backend:3100$request_uri;
          proxy_set_header Upgrade $http_upgrade;
          proxy_set_header Connection "upgrade";
          proxy_http_version 1.1;
        }

        # Ruler
        location ~ /prometheus/api/v1/alerts.* {
          set $prometheus_api_v1_alerts_backend http://loki-loki-distributed-ruler.loki.svc.cluster.local;
          proxy_pass       $prometheus_api_v1_alerts_backend:3100$request_uri;
        }
        location ~ /prometheus/api/v1/rules.* {
          set $prometheus_api_v1_rules_backend http://loki-loki-distributed-ruler.loki.svc.cluster.local;
          proxy_pass       $prometheus_api_v1_rules_backend:3100$request_uri;
        }
        location ~ /api/prom/rules.* {
          set $api_prom_rules_backend http://loki-loki-distributed-ruler.loki.svc.cluster.local;
          proxy_pass       $api_prom_rules_backend:3100$request_uri;
        }
        location ~ /api/prom/alerts.* {
          set $api_prom_alerts_backend http://loki-loki-distributed-ruler.loki.svc.cluster.local;
          proxy_pass       $api_prom_alerts_backend:3100$request_uri;
        }

        location ~ /api/prom/.* {
          set $api_prom_backend http://loki-loki-distributed-query-frontend-headless.loki.svc.cluster.local;
          proxy_pass       $api_prom_backend:3100$request_uri;
          proxy_http_version 1.1;
        }

        location = /loki/api/v1/push {
          set $loki_api_v1_push_backend http://loki-loki-distributed-distributor.loki.svc.cluster.local;
          proxy_pass       $loki_api_v1_push_backend:3100$request_uri;
          proxy_http_version 1.1;
        }

        location = /loki/api/v1/tail {
          set $loki_api_v1_tail_backend http://loki-loki-distributed-querier.loki.svc.cluster.local;
          proxy_pass       $loki_api_v1_tail_backend:3100$request_uri;
          proxy_set_header Upgrade $http_upgrade;
          proxy_set_header Connection "upgrade";
          proxy_http_version 1.1;
        }

        location ~ /loki/api/.* {
          set $loki_api_backend http://loki-loki-distributed-query-frontend-headless.loki.svc.cluster.local;
          proxy_pass       $loki_api_backend:3100$request_uri;
          proxy_http_version 1.1;
        }
      }
    }
重载采集器
修改fluent bit的发送服务host并重启fluent bit:
$ kubectl  -nloki edit cm fluent-bit-fluent-bit-loki
[Output]
    Name grafana-loki
    Match *
    Url http://loki-loki-distributed-gateway/api/prom/push # loki-loki-distributed-distributor:3100 应该也是可以的
    TenantID ""
    BatchWait 1
    BatchSize 1048576
    Labels {job="fluent-bit"}
    RemoveKeys kubernetes,stream
    AutoKubernetesLabels false
    LabelMapPath /fluent-bit/etc/labelmap.json
    LineFormat json
    LogLevel warn

$ kubectl -n loki delete po -l app=fluent-bit-loki
修改 grafana 端口
接着按照前文的介绍进行loki-grafana这个service的修改, 把端口暴露成 31000 的NodePort即可。
安装 grafana 插件
你可以使用这个模板, 可能会遇到一个报错: Panel plugin not found: grafana-piechart-panel:
./bin/grafana-cli plugins install grafana-piechart-panel
如果你是 pod 中操作, 可能要调整下权限哦
securityContext:
  runAsNonRoot: false
  runAsUser: 0
最好是把grafana这个deploy通过pvc挂载, 谨防pod重启, 导致资产丢失~
小尾巴
小白:太好了,那我就去研究一下这些资源,开始部署我们的高可用 Loki 集群。
老花:没错,小白。记得在部署和测试过程中,有任何问题都可以来问我。我们下次再聊聊如何优化日志查询和监控。