前戏
小白: golang 有哪些性能提升的技巧? 能分享一下吗?
老花: 当然可以, 我们先看下如何分析我们的程序有什么性能问题吧!
pprof 简介
pprof 是一个用于分析 Go 程序性能的工具,它提供了丰富的性能分析功能,包括 CPU、内存、goroutine、锁、网络、HTTP、GC 等等。
pprof 是 Go 语言自带的性能分析工具,可以帮助我们监控和分析程序的性能。
它有两个包:
runtime/pprof:适用于所有类型的代码,特别是非 Web 应用程序。net/http/pprof:对runtime/pprof的简单封装,适合 Web 应用程序使用,通过 HTTP 端口暴露性能数据。
pprof 监控内容
pprof 可以监控以下内容:
allocs:内存分配情况的采样信息。blocks:阻塞操作情况的采样信息。cmdline:显示程序启动命令及参数。goroutine:当前所有协程的堆栈信息。heap:堆上内存使用情况的采样信息。mutex:锁争用情况的采样信息。profile:CPU 占用情况的采样信息。threadcreate:系统线程创建情况的采样信息。
如何使用 pprof
对于 golang 代码, 我们可以使用下面这个办法来引入在线 pprof 分析工具:
import (
    _ "net/http/pprof"
    "net/http"
)

func main() {
    go func() {
        http.ListenAndServe("localhost:6060", nil)
    }()
    // 程序主逻辑
}
这样,你就可以通过 go tool pprof http://localhost:6060/debug/pprof/heap访问堆栈, 其中heap可以换成allocs、goroutines、threadcreate等。
假设你执行了heap的 pprof 交互界面,你可以使用以下命令来查看堆栈信息:
- top:显示最耗内存的函数。
- list functionName: 显示函数的代码和耗时。
- web:在浏览器中查看调用图。
- traces:显示调用追踪
举个内存泄露例子
主逻辑代码
package main

import (
	"log"
	"net/http"
	_ "net/http/pprof"
	"sync"
)

type UserData struct {
	mu    sync.RWMutex
	Cache map[string][]byte
}

func NewDataMgr() *UserData {
	return &UserData{
		Cache: make(map[string][]byte),
	}
}

var dataMgr = NewDataMgr()

func write(w http.ResponseWriter, r *http.Request) {
	userID := r.URL.Query().Get("user")

	dataMgr.mu.Lock()
	defer dataMgr.mu.Unlock()
	dataMgr.Cache[userID] = make([]byte, 1000000)
	log.Printf("Added data for user %s. Total users: %d\n", userID, len(dataMgr.Cache))
}

func read(w http.ResponseWriter, r *http.Request) {
	userID := r.URL.Query().Get("user")

	dataMgr.mu.RLock()
	defer dataMgr.mu.RUnlock()

	if userData, exists := dataMgr.Cache[userID]; exists {
		log.Printf("Found data for user %s, len: %d, cap: %d\n", userID, len(userData), cap(userData))
	} else {
		log.Printf("not found %s. Total users: %d\n", userID, len(dataMgr.Cache))
	}
}

func main() {
	go func() {
		http.ListenAndServe("localhost:6060", nil)
	}()
	http.HandleFunc("/write", write)
	http.HandleFunc("/read", read)
	http.ListenAndServe(":8080", nil)
}
这里做了以下几件事情:
- 异步启动一个监听在
localhost:6060的HTTP服务器,用于pprof性能分析。 - 设置
/write路由的处理函数为write。 - 设置
/read路由的处理函数为read。 - 启动主
HTTP服务器,监听在:8080 端口。
执行这个程序:
$ go mod init
$ go mod tidy
$ go run main.go
接下来, 你可以用ab去执行read/write接口的压测, 但是身为一个 gopher, 你肯定不会去手动去执行压测, 所以我们可以使用go benchmark压测。
装杯时刻来了~
benchmark 代码
import (
	"math/rand"
	"net/http"
	"strconv"
	"testing"
	"time"
)

func Benchmark_ReadWriteHttp(b *testing.B) {
	rand.Seed(time.Now().UnixNano())
	source := rand.NewSource(time.Now().UnixNano())
	random := rand.New(source)

	// 复用 HTTP 客户端
	client := &http.Client{}

	b.ResetTimer()
	b.SetParallelism(1000)

	b.RunParallel(func(p *testing.PB) {
		for p.Next() {
			resp, err := client.Get("http://localhost:8080/write?user=" + strconv.Itoa(random.Intn(1000)))
			if err != nil {
				b.Error(err)
				continue
			}
			resp.Body.Close() // 确保关闭响应体
			b.Logf("write resp status: %d", resp.StatusCode)
		}
	})

	b.RunParallel(func(p *testing.PB) {
		for p.Next() {
			resp, err := client.Get("http://localhost:8080/read?user=" + strconv.Itoa(random.Intn(1000)))
			if err != nil {
				b.Error(err)
				continue
			}
			resp.Body.Close() // 确保关闭响应体
			b.Logf("read resp status: %d", resp.StatusCode)
		}
	})
}
运行这个benchmark, 或者用你的代码编辑工具, 比如vscode, 直接运行 benchmark 就可以了。
$ Running tool: /usr/local/go/bin/go test -benchmem -run=^$ -bench ^Benchmark_ReadWriteHttp$ github.com/cloud-database-tools/golang/memory-leak/testcase

goos: linux
goarch: amd64
pkg: github.com/cloud-database-tools/golang/memory-leak/testcase
cpu: 11th Gen Intel(R) Core(TM) i7-1165G7 @ 2.80GHz
Benchmark_ReadWriteHttp-4   	    2407	    572900 ns/op	   30487 B/op	     199 allocs/op
--- BENCH: Benchmark_ReadWriteHttp-4
    memoryleak_test.go:30: write resp status: 200
    memoryleak_test.go:42: read resp status: 200
    memoryleak_test.go:30: write resp status: 200
    memoryleak_test.go:30: write resp status: 200
    memoryleak_test.go:30: write resp status: 200
    memoryleak_test.go:30: write resp status: 200
    memoryleak_test.go:30: write resp status: 200
    memoryleak_test.go:30: write resp status: 200
    memoryleak_test.go:30: write resp status: 200
    memoryleak_test.go:30: write resp status: 200
	... [output truncated]
PASS
ok  	github.com/cloud-database-tools/golang/memory-leak/testcase	2.420s
我们查看主程序的日志输出:
2024/12/20 12:58:18 Found data for user 841, len: 1000000, cap: 1000000
2024/12/20 12:58:18 Found data for user 902, len: 1000000, cap: 1000000
....
pprof 诊断
$ go tool pprof http://localhost:6060/debug/pprof/heap
Fetching profile over HTTP from http://localhost:6060/debug/pprof/heap
Saved profile in /root/pprof/pprof.main.alloc_objects.alloc_space.inuse_objects.inuse_space.002.pb.gz
File: main
Type: inuse_space
Time: Dec 20, 2024 at 11:00am (CST)
Entering interactive mode (type "help" for commands, "o" for options)
(pprof) top
Showing nodes accounting for 965.12MB, 99.48% of 970.12MB total
Dropped 22 nodes (cum <= 4.85MB)
Showing top 10 nodes out of 11
      flat  flat%   sum%        cum   cum%
  945.55MB 97.47% 97.47%   945.55MB 97.47%  main.write
   11.54MB  1.19% 98.66%    11.54MB  1.19%  bufio.NewWriterSize (inline)
    7.03MB  0.72% 99.38%     7.03MB  0.72%  bufio.NewReaderSize (inline)
       1MB   0.1% 99.48%     5.51MB  0.57%  net/http.(*conn).readRequest
         0     0% 99.48%     7.03MB  0.72%  bufio.NewReader (inline)
         0     0% 99.48%   945.55MB 97.47%  net/http.(*ServeMux).ServeHTTP
         0     0% 99.48%   967.12MB 99.69%  net/http.(*conn).serve
         0     0% 99.48%   945.55MB 97.47%  net/http.HandlerFunc.ServeHTTP
         0     0% 99.48%     7.03MB  0.72%  net/http.newBufioReader
         0     0% 99.48%    11.54MB  1.19%  net/http.newBufioWriterSize

(pprof) list write
Total: 970.12MB
ROUTINE ======================== main.write in /root/go/src/github.com/cloud-database-tools/golang/memory-leak/main.go
  945.55MB   945.55MB (flat, cum) 97.47% of Total
         .          .     23:func write(w http.ResponseWriter, r *http.Request) {
         .          .     24:   userID := r.URL.Query().Get("user")
         .          .     25:
         .          .     26:   dataMgr.mu.Lock()
         .          .     27:   defer dataMgr.mu.Unlock()
  945.55MB   945.55MB     28:   dataMgr.Cache[userID] = make([]byte, 1000000)
         .          .     29:   log.Printf("Added data for user %s. Total users: %d\n", userID, len(dataMgr.Cache))
         .          .     30:}
         .          .     31:
         .          .     32:func read(w http.ResponseWriter, r *http.Request) {
         .          .     33:   userID := r.URL.Query().Get("user")
这个输出表明了在main.write函数中,每次请求都会创建一个1000000字节大小的切片,并且这个切片会一直存在于内存中,直到程序退出。
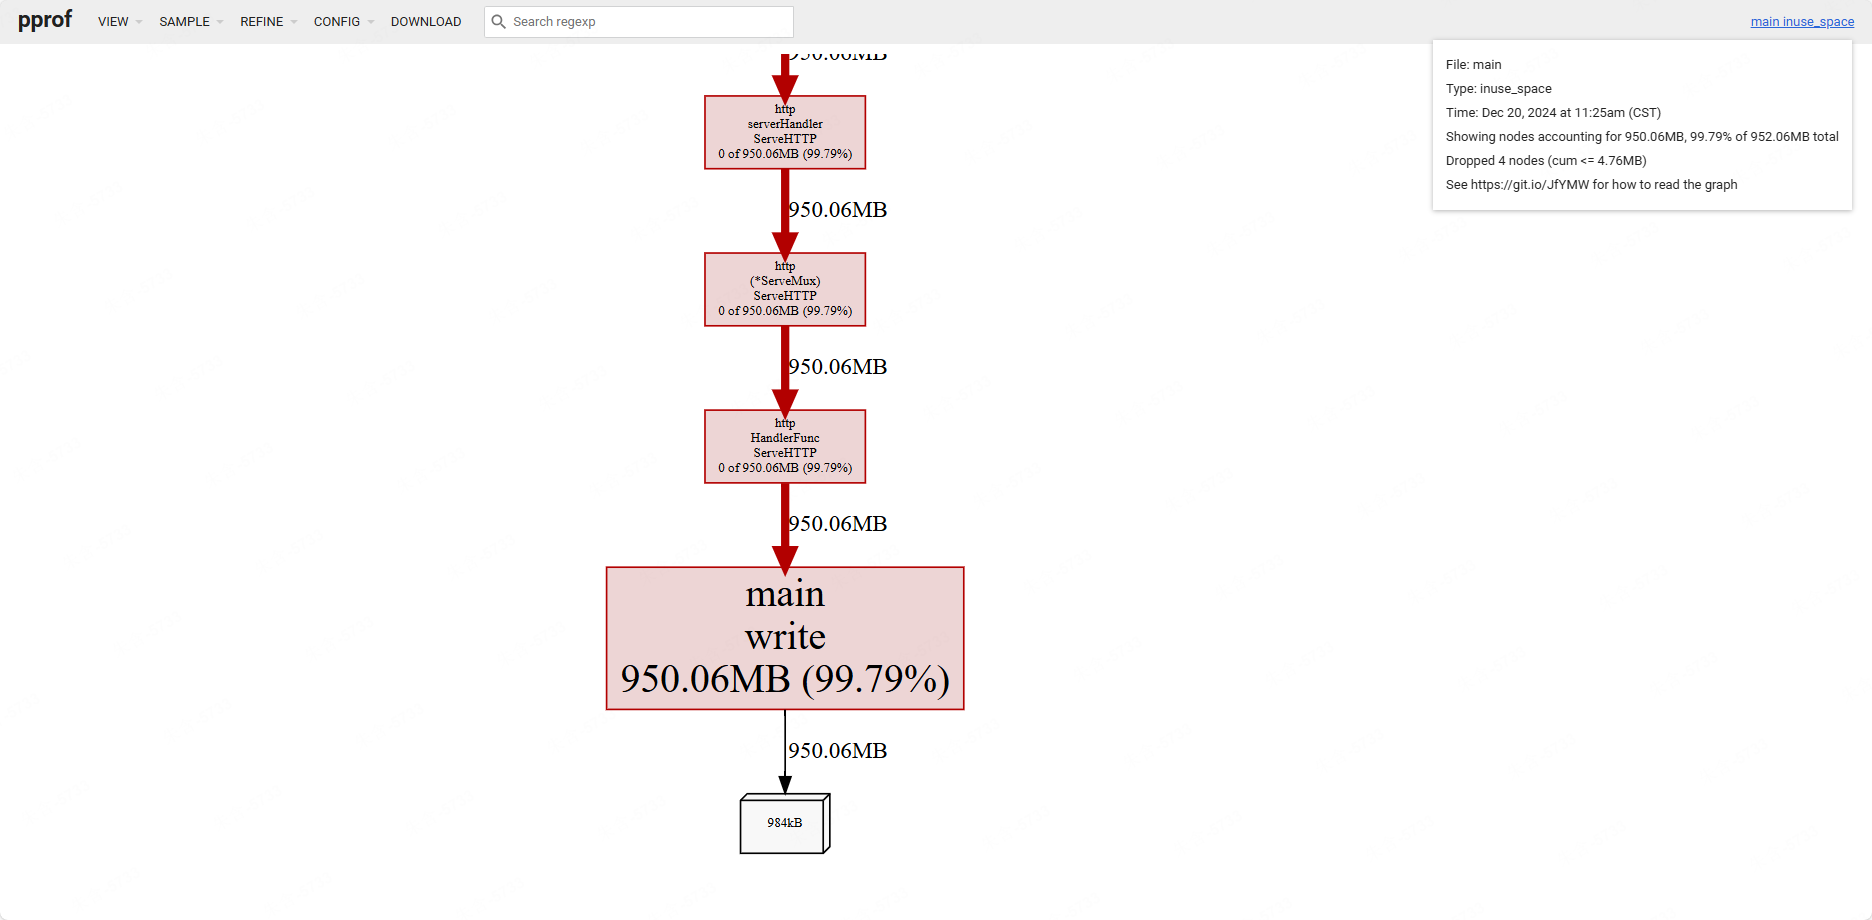
在线性能分析
$ go tool pprof -http=localhost:6061 http://localhost:6060/debug/pprof/heap
其实, pprof 还支持diff模式:
$ curl -s http://localhost:6060/debug/pprof/heap > before.heap
$ curl -s http://localhost:6060/debug/pprof/heap > after.heap
$ go tool pprof -http=localhost:8081 --base before.heap after.heap
也就是说, 我们就能对比出优化前后的的性能效果了。
小尾巴
老花: 既然 pprof 能帮助我们找到内存泄漏,那我们又有哪些手段来提升程序性能? 不知道你有没有听说过对象复用? 下一期我们来一起学习下吧!